ATG 10 Available

21 12 2010

ATG 10 is now available for download. The product documentation and software distribution can be downloaded from the customer care section of ATG.com. This release of the product is ATG’s most significant release to date.

ATG 10 adds a number of notable new features to the offering you’ll want to check out. The list below is only a brief introduction to some of the new features that ATG 10 brings so be sure to check out the latest information on both the ATG Community and ATG.com.

Here’s a short list of the key enhancements and new features in ATG 10.

  • Unified Multi-Site architecture
  • Multi-Site Administrations tools
  • Enhanced Merchandising tools
  • Promotions engine and template driven promotions wizard
  • Enhanced Reference Store

Finally take a look at the latest version of the ATG Business Intelligence and Analytics catalyst asset on the ATG Community site. It was recently updated to support ATG 10 and contains some exciting new features listed below as well.

  • Added support for ATG 10.0
  • Two new performance dashboards. Discover ‘how’ the business performing at a glance.
    • Promotions Performance Dashboard: Analyze how promotions affect your bottom line
    • Customer Analytics Dashboard: Better understand the mix of customers and segment behavior.
  • Easy to consume. Installs in minutes in existing ACI 9.1 or ACI 10.0 environment.
  • Sample data set allowing one to experiment with report and dashboard ideas.
  • Improved content navigation: drill down to gain deeper insight or drill across to view different perspectives.

Any feedback you might have on ATG 10 would be greatly appreciated. Please post your comments to the ATG Community.



ATG Business Intelligence and Analytics – Screenshots

31 03 2010

Here are some screen shots of the ATG Business Intelligence and Analytics catalyst asset for those who would like to see some of the dashboards that are included in the asset. For detailed information about the asset and information on how to download this asset use the following link.

https://community.atg.com/docs/DOC-1799

Each of these three  dashboards was developed using Report Studios professional authoring mode.  It probably took me more time thinking about what content to include on the dashboards then anything else. But once I knew what content made the most sense the development went rather smoothly. I guess it goes to show you that sometimes the hardest part of developing reports/dashboards is figuring out what content to include and how best to represent it (ie text, graph).

One of the other greatest things about using a tool like Report Studio is that you can rapidly develop a prototype for what you want to show and get immediate feedback. Then turn around and make adjustments to your design and get more feedback. In other words it a great tool to use for agile development. And thanks to all of you the provide valuable feedback!

One of my favorite things about these dashboard is the uses of conditional formatting to draw the consumers eye towards the problem areas. As you can see from the screen shots ones eye is immediately drawn to the ares which are under-performing because the format of the data is altered. Usually by changing the color. In someplace the color intensifies from yellow to a bright red as a function of  the change in magnitude of a particular KPI . You can see this in particular on the Sales Performance Dashboard for example.

And now the screen shots (click-to enlarge):

Sales Performance DashboardProduct Performance DashboardSite Performance Dashboard


ATG Business Intelligence and Analytics – Catalyst Asset

10 03 2010

Recently I’ve been working on a catalyst asset to demonstrate the business intelligence capabilities of ATG Customer Intelligence (ACI) called the ATG Business Intelligence and Analytics module. Actually there are a number of features included in this catalyst asset that aren’t currently part of the product. I’ve listed some of them below.

  • Unified metadata model allowing the authoring of query/reports across platform, commerce, search and service center data.
  • Over 50+ predefined calculations available for report authors to use. Smart data sorting and formatting.
  • Three performance management dashboards. Discover ‘how’ the business performing at a glance.
    • Sale Performance Dashboard: Analyze multi-channel sales
    • Product Performance Dashboard: Merchandizing analysis of product performance, including customer profile and co-buys (market-basket analysis).
    • Site Performance Dashboard: Analyze traffic, search and conversion data
  • Two reporting packages available to author report with.
    • ATG (Query):  Author reports or ad-hoc queries using simple query interface
    • ATG (Analysis): Perform advanced data analysis using dimensional query interface. Slice and dice data using dimensional functions and operations as if interacting with a data cube.
  • Easy to consume. Installs in minutes in existing ACI 9.1 environment.

The asset is available for download on the ATG Community site.


Register for ATG Insight Live Online 2009

9 10 2009

This years ATG Insight Live conference is taking place online. This is ATG first virtual conference so it should be pretty exciting. There are a number of both business and technical tracks so there’s something for everybody. I strongly recommend attending for anyone doing work with ATG.

The conference begins October 21st. For conference agendas and registration use the link below.

http://events.unisfair.com/index.jsp?eid=459&seid=33


ATG named leading B2C e-Commerce platform by Forrester

30 01 2009

ATG took top honors in the Q1 2009 Forrester Wave™ B2C eCommerce Platforms. The report is available from the ATG web site but you can read the report directly by clicking here.

ATG and IBM both lead the pack this year in both strategy, offering and market presence.  ATG landed perfect scores in a number of important categories such as architecture and scalability. But ATG scored a perfect score in the following cetgories a feat none of the other participating vendors could match. Congratulations ATG!

  • Personalization
  • Business Reporting
  • Email Marketing
  • Customer Data Management
  • Product Configurator
  • User Generated Content (UGC)
  • Customer Service Representative (CSR) User Interface/Module
  • Returns/exchanges


Build a Better Dashboard: Multi-Channel Sales Dashboard

12 01 2009

I recently posted an entry entitled Build A Better Dashboard in which I described how to build a product dashboard using ATG Customer Intelligence. In this follow up to that post I’ve built a multi-channel sales dashboard using Report Studio. 

Sales Dashboard (click to enlarge)

Sales Dashboard (click to enlarge)

You can find a screenshot of this dashboard to your right. To show the detail just click on the image to enlarge it. I’ve even included the source code and instructions for how to deploy it below if you wanted to take a closer look at it in your own environment.

The dashboard includes key performance indicators for important business processes. In the upper left hand corner are the most important metrics as this is where the eye generally starts looking for content on a dashboard. You’ll find metrics on sales, traffic and returns and sparkline chart indicating how these metrics are trending.

To the left of this area are key metrics broken out by sales channel. It compares the key performance indicators across channels. In this case how they are performing on the web channel versus how they are performing in the contact center channel.  

Finally at the bottom we have some more interesting content indicating the top ten selling products by net sales as well as top revenue producing search terms and what products were purchased using those terms.

The great things about this dashboard is that it brings together a lot of data from multiple sources into a single place where it can be reviewed daily. Add baslines and targets for these metrics and the dashboard because a great tool for performance management. It’s an excellant example of how you can use ATG Customer Intelligence to bring data from multiple products in the ATG Commerce Suite including  Commerce Search and ATG Commerce Service Center.

The following step-by-step instructions can be used to install the report in your environment.

  1. Copy report definition to clipboard.
  2. Start Report Studio with the ‘Commerce (model)’ package.
  3. Select ‘Create a new Report or Template’.
  4. Select a ‘Blank’ Template.
  5. From the Tools menu select ‘Open report from Clipboard’.
  6. Save the report definition to the content store.

Click here to download the report definition (Note: In order to workaround some limitations in wordpress I’ve created the definition in a word document.)


5 Things to do with your ATG Data Warehouse

2 01 2009

ATG Customer Intelligence offers a multitude of great features for business reporting and analytics but the real prize isn’t with all the tools it ships with but with the information that lives in your ATG data warehouse. There are so many things that you could be doing with that data. Here’s just a few ideas to get you thinking this year.

Build a Better Dashboard

Unless you’re like me you can’t really expect that everyone will look at 20 different reports on a daily or weekly basis to get an understanding of how their business is doing. So put together a dashboard that combines all the pertinent information you want to know about your business on a daily/weekly basis. ATG Customer Intelligence contains all the tools you need to build such a dashboard. See the following  post for more details about building a better dashboard.

Performance Management

The data in the ATG data warehouse contains a lot of information about whats happening on your eCommerce site.  But how do you really know if your merchandising or marketing strategy is reaching their goals. That’s where performance management comes in. Performance management allows you to measure the business outcomes against stated goals.  All you need to do is supply the targets and then use ATG Customer Intelligence to track your progress against these goals.

Market Basket Analysis

I’ve posted about this before so I won’t go into too much detail about it here. Market basket analysis allows you to get a better understanding of what products sell well together.  It allows you to understand that the “Camel Pea Coat” sells extremely well with the “Wool Hat” and “Wool Mittens”. This technique is a great way to understand what items might cross-sell together. And it’s all back by concrete data and not just intuition.

Mine for Gold

If you’re a real data nut then you might try your hand at applying some data mining techniques to mine information from the data in the data warehouse. The market basket analysis technique mentioned above is actually one such technique that can be used to mine associations rules between products but many other techniques exist that allow you discover other types of information. For instance knowledge discovery techniques exist that will allow you segment your customer base. You could then turn around an use this information to build better customer segments and help improve your personalization efforts.

Analyze This!

Query studio is a tool that ships with ATG Customer Intelligence that allows to perform ad-hoc queries against data in the ATG data warehouse. This tool is great for those times that you want to explore a little. You might uncover something interesting during your explorations. I know I’ve found some really interesting facts using this tool such as gift boxes tend to sell more during the holidays. That’s probably not surprising but they were purchased by males 10x more then females on your typical clothing retailer site.  This is the type of stuff that you probably don’t have a report built to tell you this and just shows you how exploring a little can get you to better know your customer.


Build a Better Dashboard

20 11 2008

There’s so much you can do with the data in the ATG Data Warehouse. One of the things I recently tried exploring was building a better dashboard. ATG Customer Intelligence ships with a number of interesting dashboards but I was recently inspired by the work of Stephen Few and others on building better a better dashboard. So challenged myself to see if I could build something similar using Report Studio.

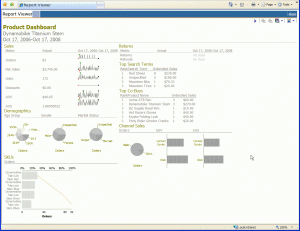
It turns out that you can and it really isn’t that difficult. The following Product Dashboard was developed in just a few hours using Report Studio and uses many of the guidelines described by Stephen Few such as placing your most important metrics in the upper left, the use of spark lines for showing trends and making the data (vs non-data) prominent and clear.

Product Dashboard (click to enlarge)

Product Dashboard (click to enlarge)

The place where I spent the most of my time was  in the layout. That may be because I’m really bad when it comes to laying out visual components. I settled on a grid layout using the cells of a table to layout the major components.

I used a few tricks to produce the spark lines charts. I started with a simple line chart. Next I modified the size of the chart to a fixed height and width of 35×80 pixels. I removed the legend and hide the Y1 and ordinal axis. I also removed the grid lines and axis labels. If you do all that you can pretty much simulate a spark line chart using report studio.

I did some of the same things for both the pie and horizontal bar charts. Report studio gives you a lot of fine control over the visual aspects of your charts. You just need to fool around a little with the various properties to get the look you want.

Besides all the whiz-bang stuff described above this dashboard also demonstrates some really interesting things you can do with the data in the ATG data warehouse. For instance under the Channel Sales section I’ve broken out sales metrics by channel. In the Top Search Terms section I’ve included data about top search terms used to purchase the selected product. There’s also a section entitle Returns which shows information about returns and refunds. Lastly the Top Co-Buys section demonstrates how you can discover cross-sell relationships using the data in the warehouse.

If you’ve got an interesting dashboard idea write to me and let me know.


Blog: ATG Solutions Strategy

14 07 2008

I just came across this awesome blog about ATG. It’s called ATG Solutions Strategy and it contains a wealth of knowledge about implementing ATG solutions from a business perspective.


ATG Developer Community and Wiki

13 06 2008

Some folks at spark::red have put together a ATG developer community wiki.. They’ve got forums, technical articles, FAQs and other content. They’ve even got some open source code posted.

 If you’re interested in checking it out the link is below.

http://developer.sparkred.com